
Introduction
If you are rocking VSCode as your IDE for Golang development and haven’t installed the debugger, I would recommend you to do it now. And Don’t worry, I’ve got your back. In this friendly guide, I’m going to walk you through the process of setting up and configuring the Golang debugger in VSCode.
Step by step guide
1. Install the Debugger for Golang
Delve, a fantastic open-source project, is your go-to debugging companion for Golang in VSCode. This powerful tool works like a charm on Linux, macOS, Windows, and FreeBSD. For this guide, we’ll focus on Windows, but the steps remain consistent across other platforms
Installing Delve is a breeze. Just run the command below in your terminal.
go install github.com/go-delve/delve/cmd/dlv@latest
Once the Go packages are downloaded, you’ll want to ensure that dlv is in your $GOPATH/bin or $HOME/bin. On my Windows setup, it’s comfortably nestled at C:\Users\oscar\go\bin\dlv.exe. You can confirm this by typing:
$ where dlv
C:\Users\oscar\go\bin\dlv.exe
2. Configure VSCode for Debugging
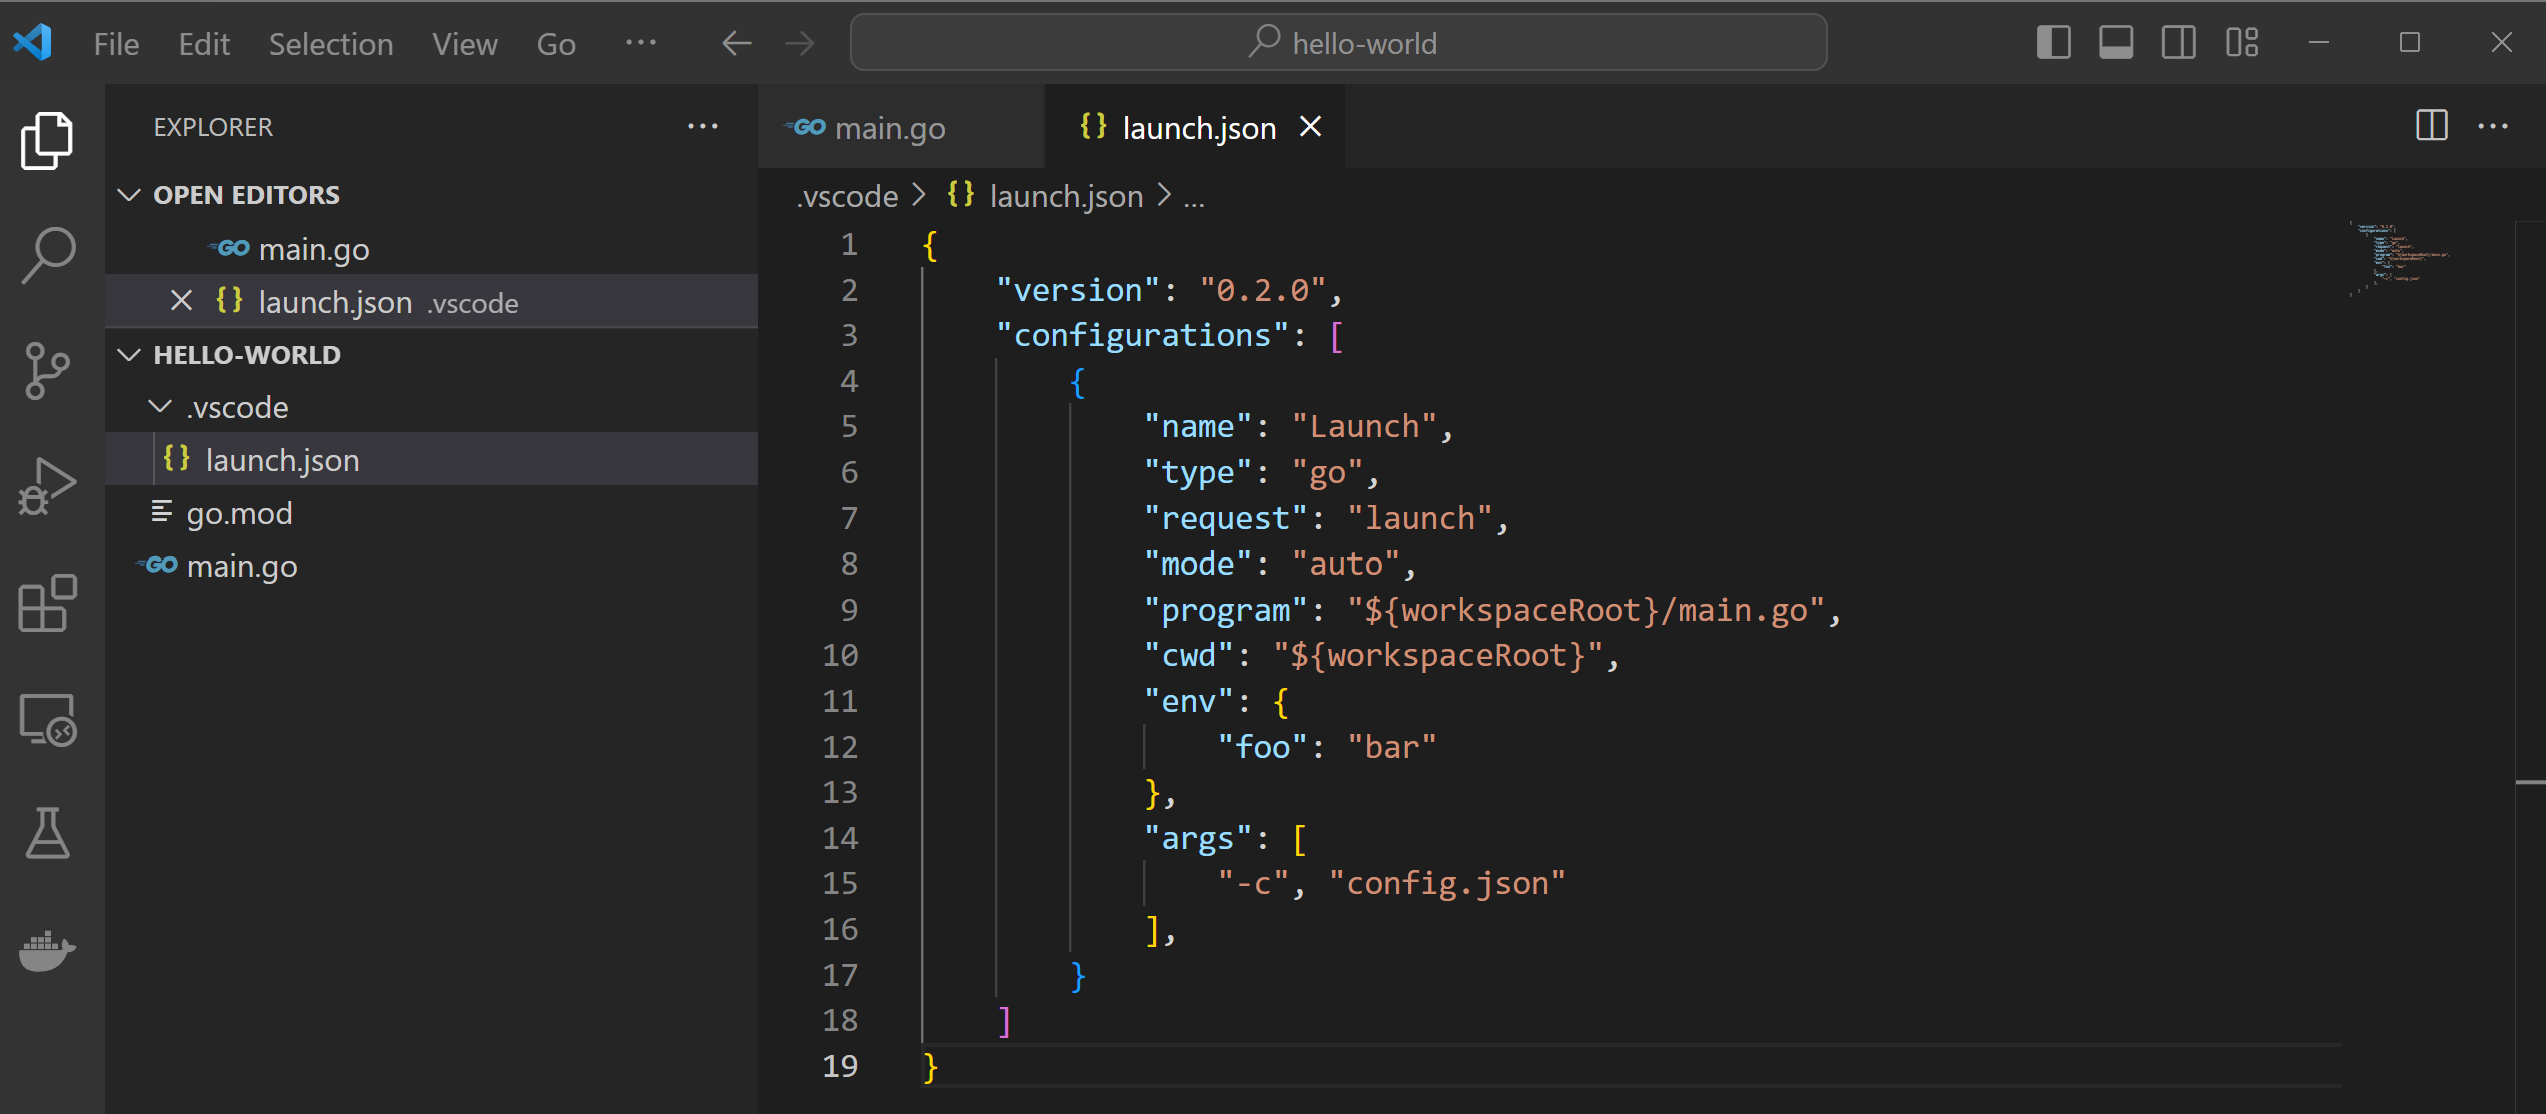
Now that Delve is cozy on your system, let’s help VSCode play along! Open up your Golang project in VSCode and create a delightful new file named launch.json within the .vscode folder at the root of your project. Copy and paste this nugget of code into your shiny new launch.json file:
{
	"version": "0.2.0",
	"configurations": [
		{
			"name": "Launch file",
			"type": "go",
			"request": "launch",
			"mode": "debug",
			"cwd": "${workspaceRoot}",
			"program": "${fileDirname}",
			"env": {},
			"args": []
		}
	]
}
💡Line 9: Specify the path of your main.go file. If it is in the project root directory. You can keep it simple with "${workspaceRoot}/main.go" instead. Got a subdirectory like cmd? No worries! Try "${workspaceRoot}/cmd/main.go" instead.
💡Line 10: Got some environment variables in your project? you can specify them here.
💡Line 11: If your project requires some arguments, such as a command line program, you can specify them here.
Oh, and here’s how it looks in my setup:
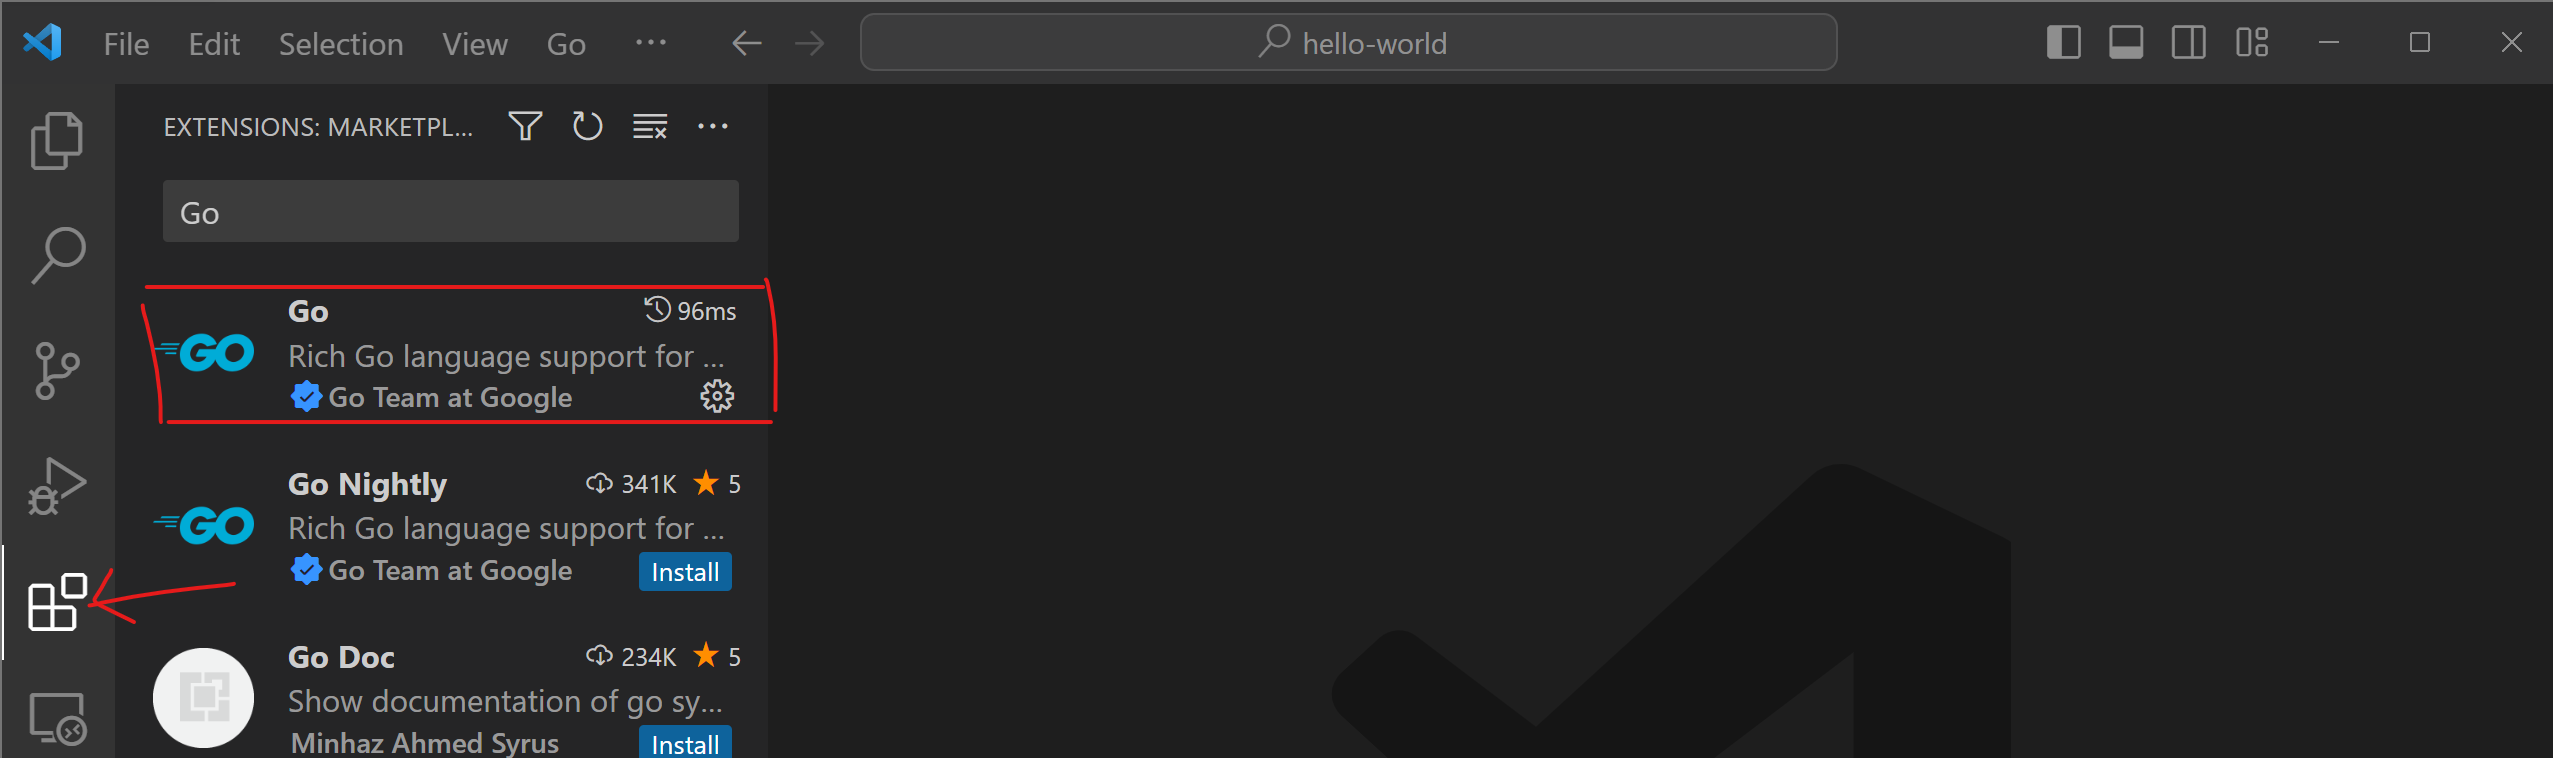
3. Install Go Extension on VSCode
Before we dive into debugging, let’s make sure your VSCode is properly equipped. Install the Go extension by navigating to the Extensions view on the left side of the editor, or use the shortcut Ctrl+Shift+X. Search for Go and install it.
4. Start Debugging
Now let’s dive into the debugging mode. Open up the main.go file and pick a line where you want to work your debugging magic, and set a breakpoint. Then open the Run and Debug view on the left side of the editor, or use the shortcut Ctrl+Shift+D. Click the Launch button on the top of the view and watch your program come to life under the debugger’s watchful gaze.
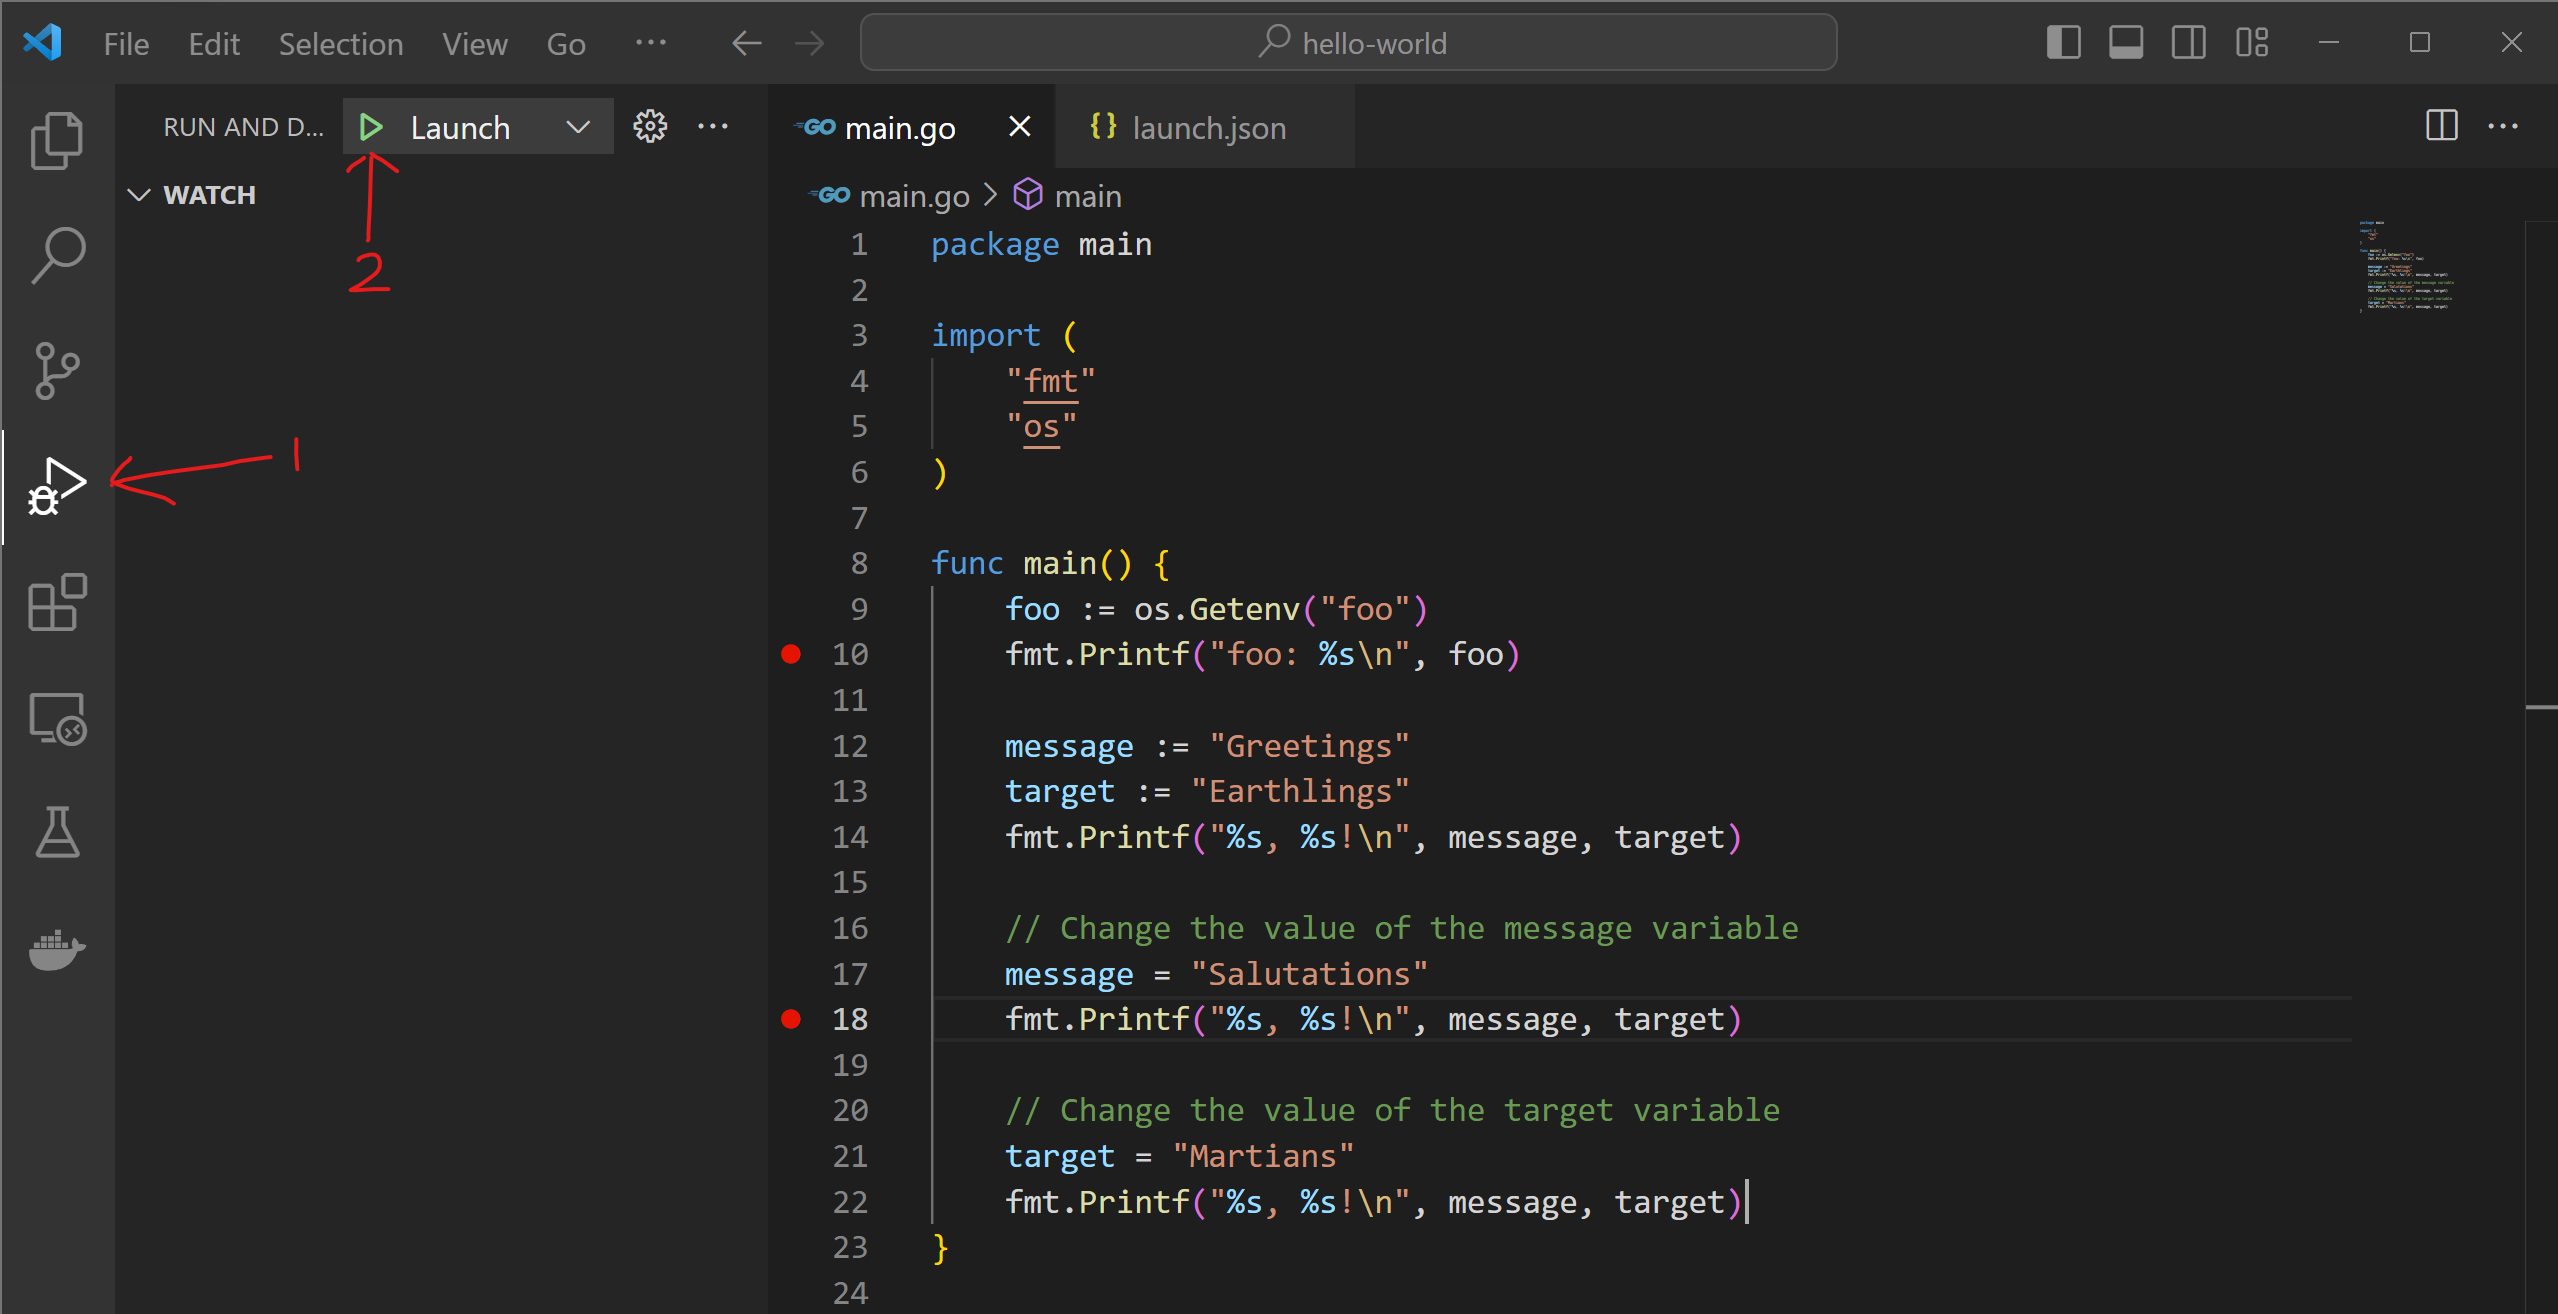
Voila! You are now in the debugging mode.
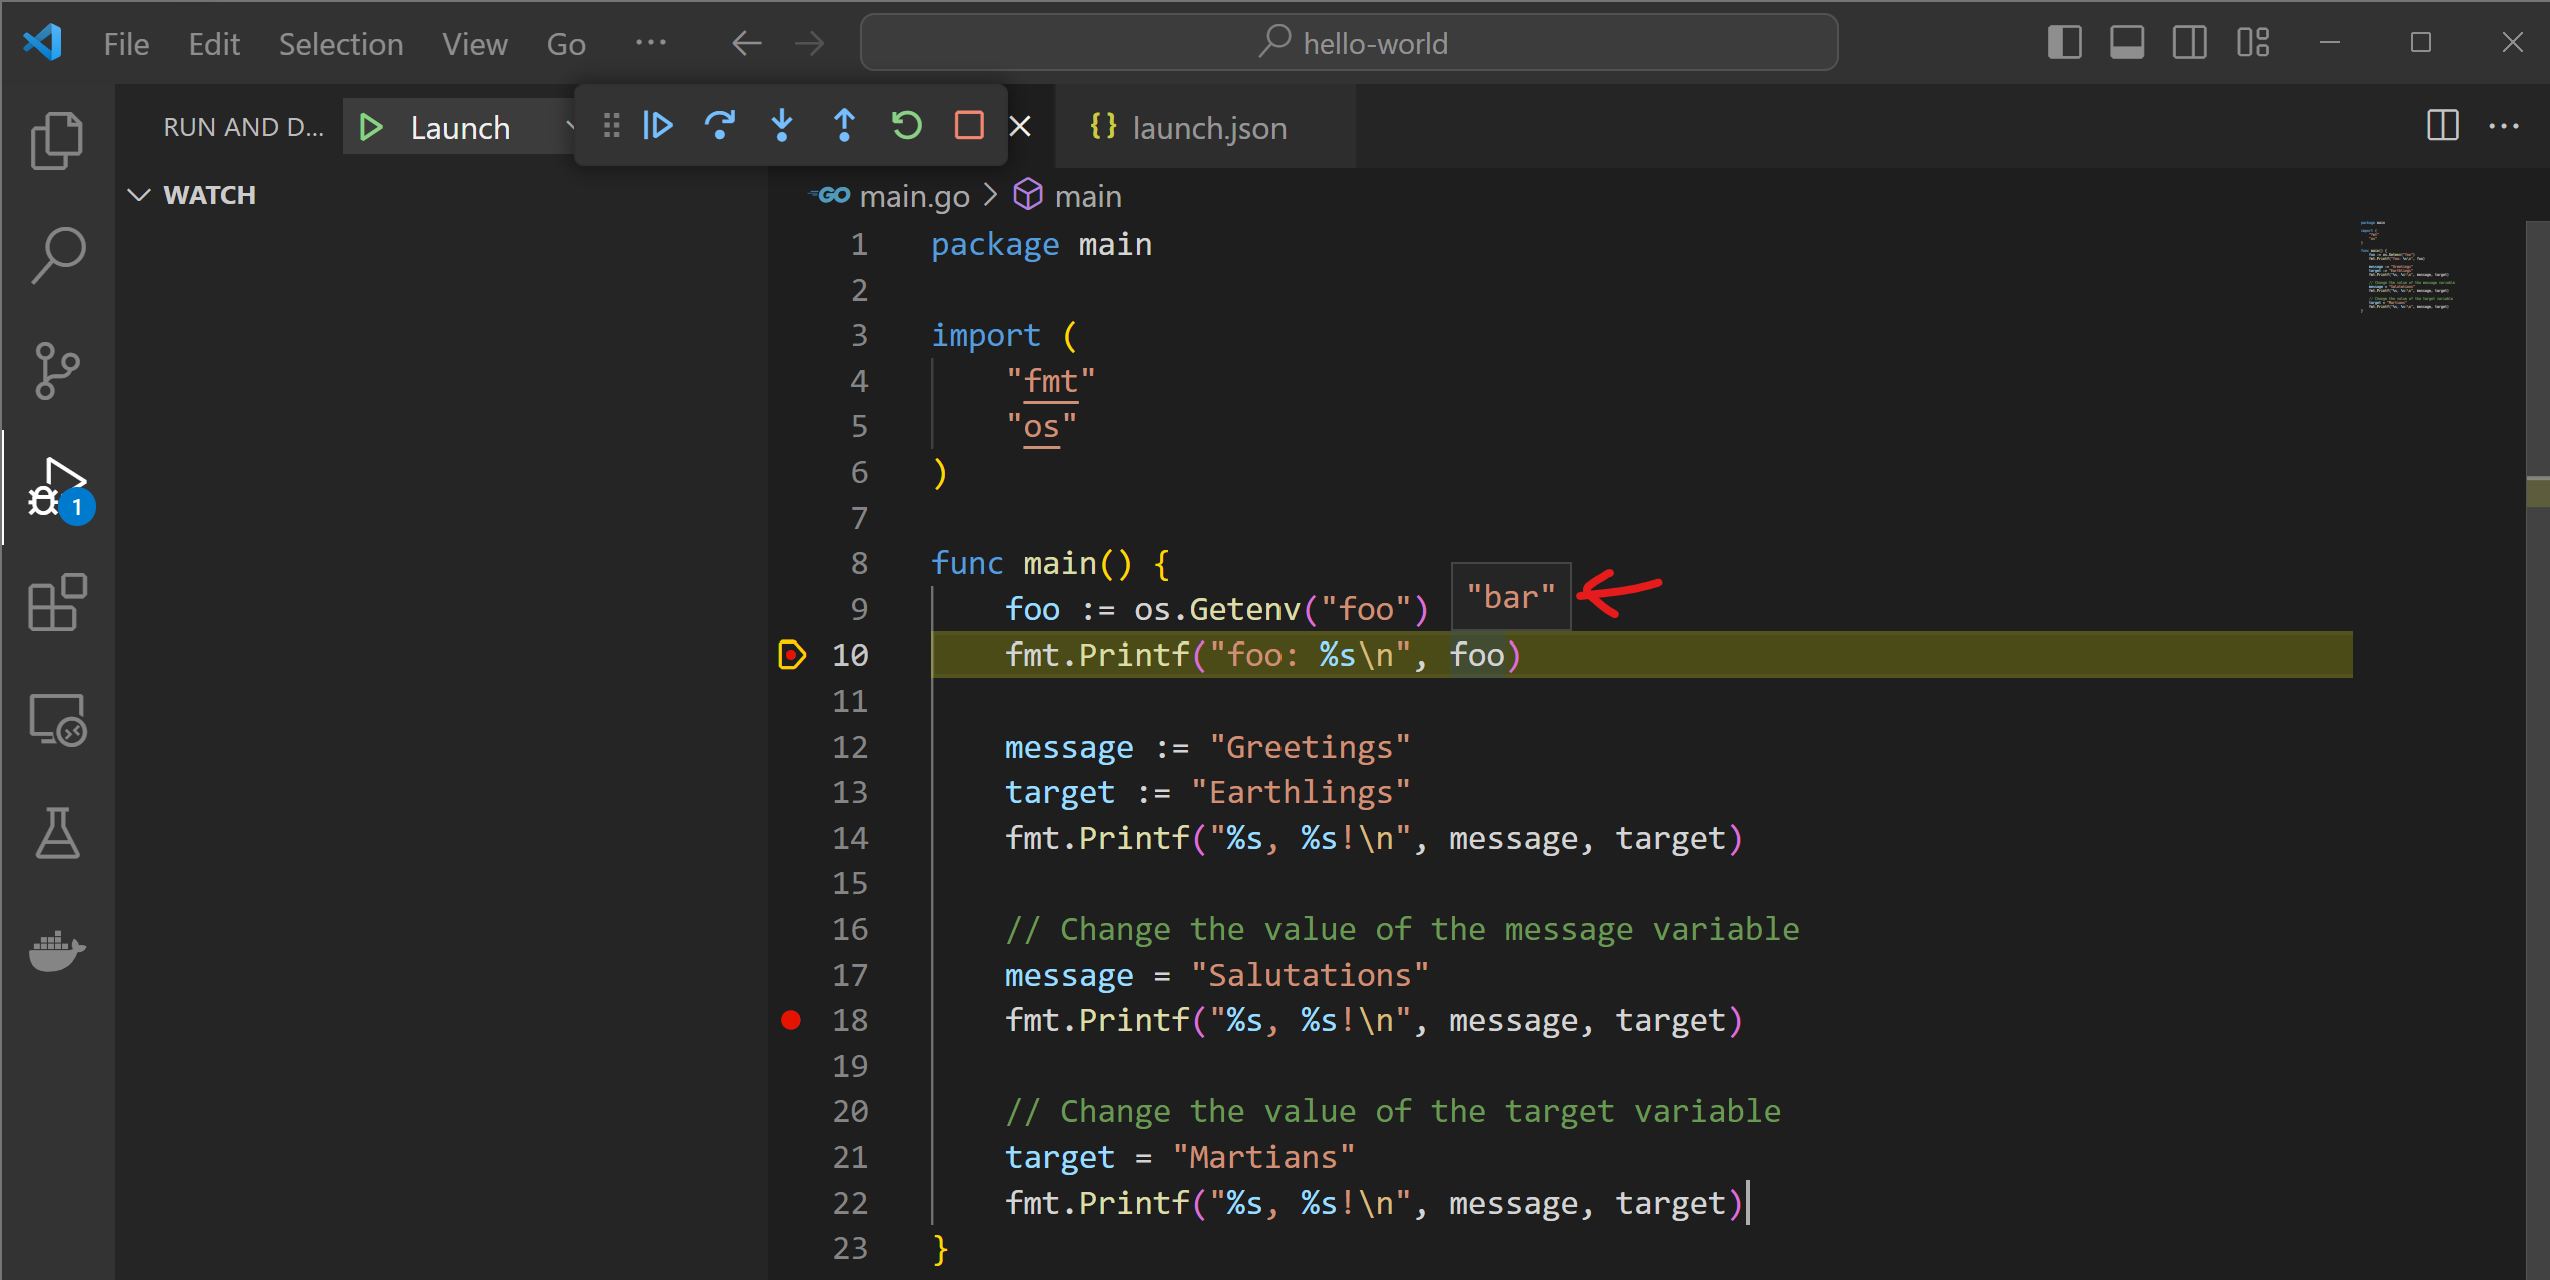
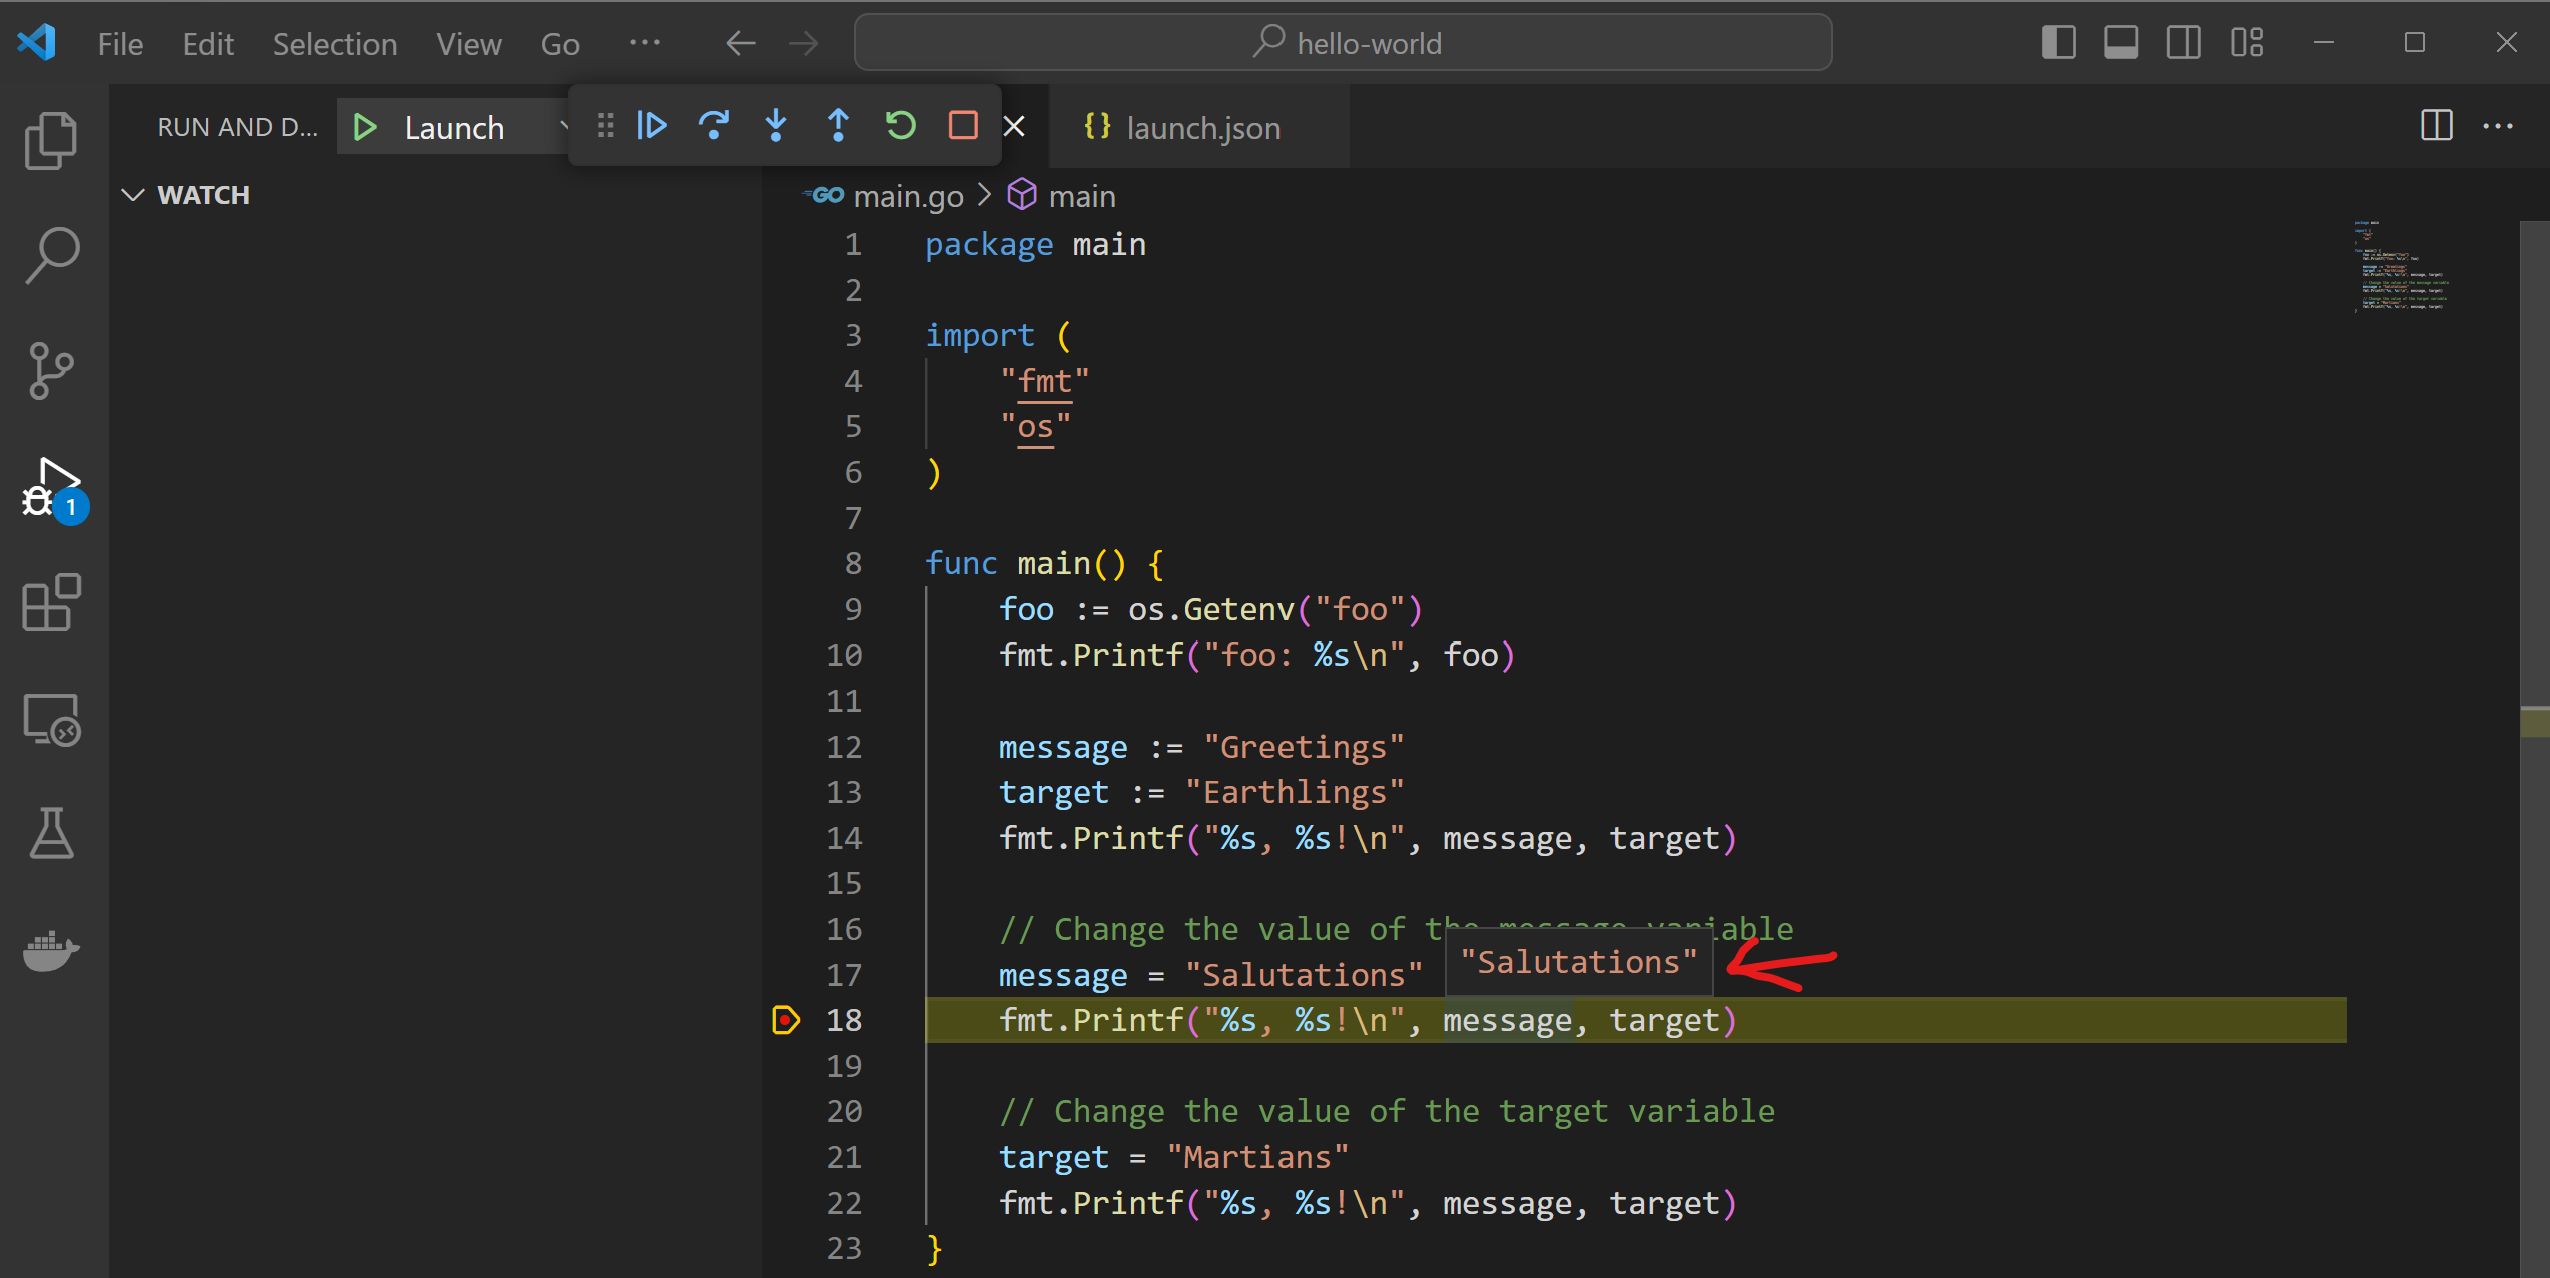
We did it! 🎉🎉 It’s pretty straightforward, isn’t it? When the program is in the debug mode, you can see there is a floating bar on the top of the editor. You can use it to control the debugger.
Conclusion
With the Golang debugger by your side, you’re well-equipped to conquer bugs with confidence. It’s a time saver, a bug-buster, and a great tool for Golang development.
The example code shown above can be found from my Github repository.
Enjoyed this article? Support my work with a coffee ☕ on Ko-fi.
